KPI Dashboard
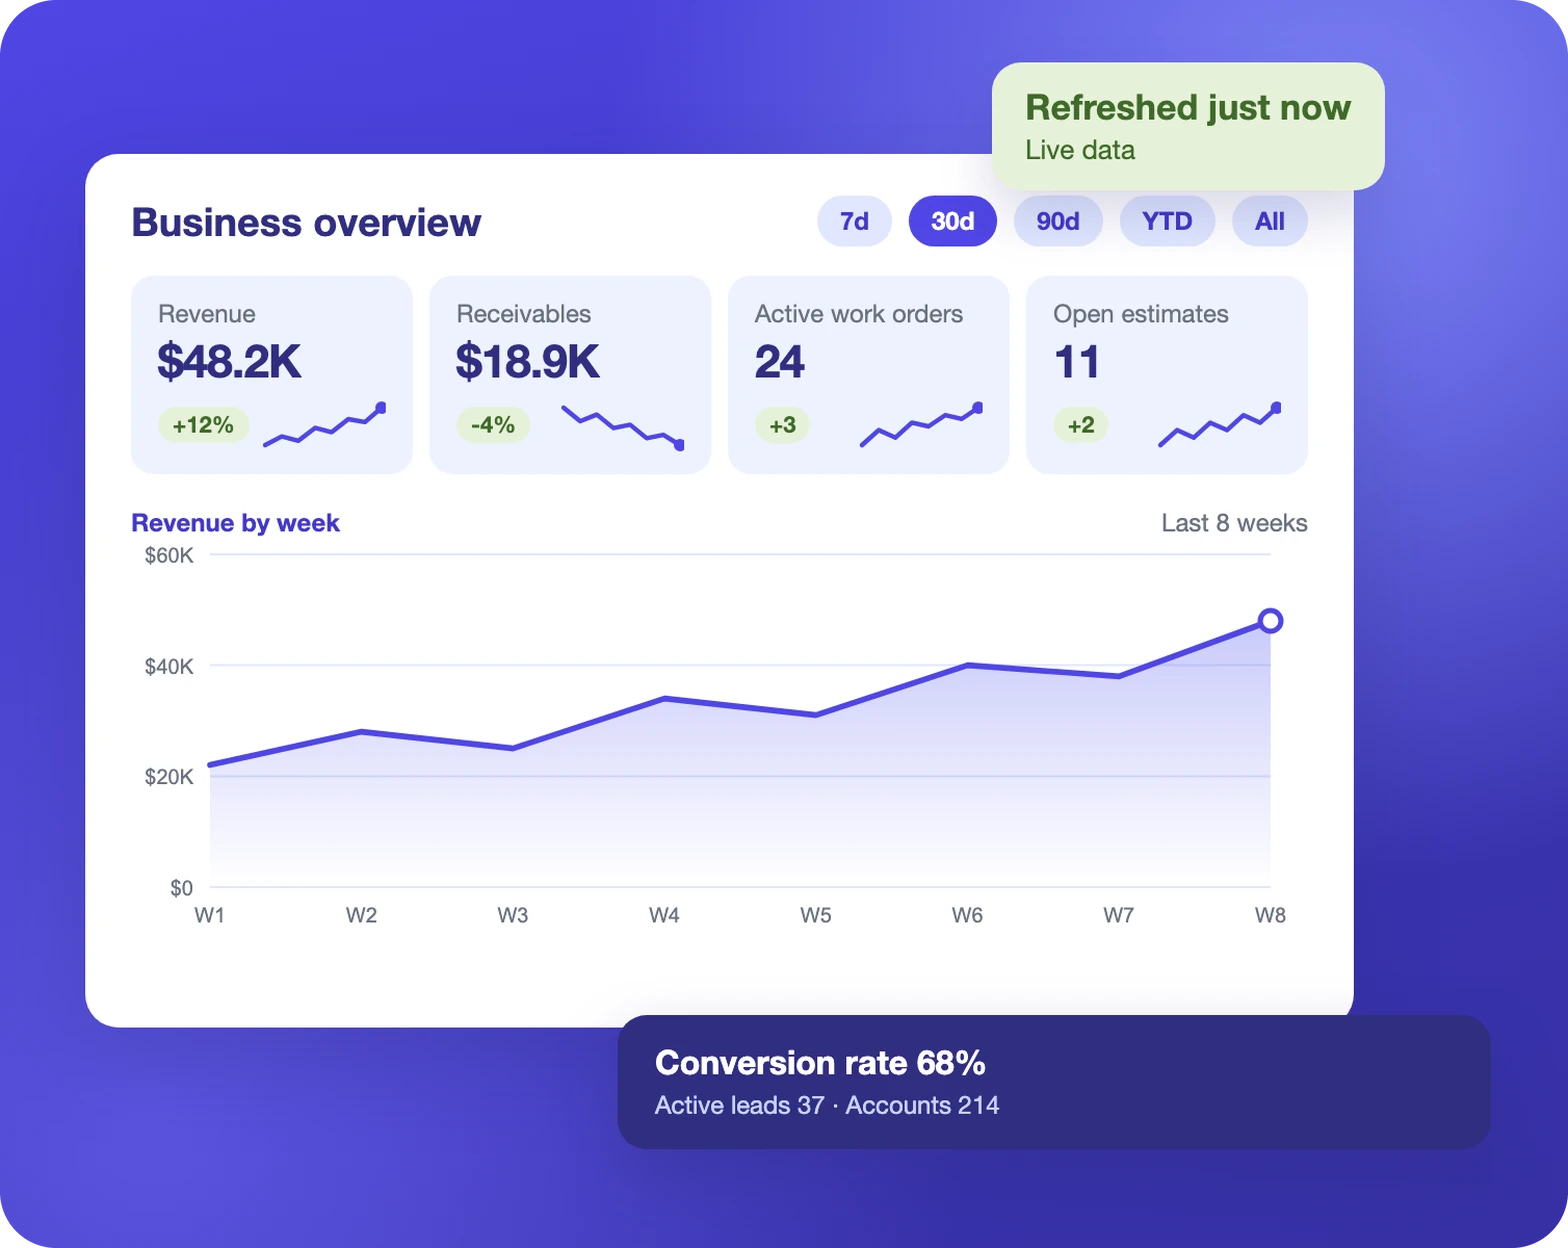
Revenue, outstanding receivables, active work orders, completed jobs, open estimates, conversion rate, active leads and accounts on one screen. Switch between 7 days, 30 days, 90 days, year to date and all time, and refresh on demand.
Reporting & Analytics
Run revenue, job margin, receivables and technician
reports from the same records as schedules, estimates
and invoices, with lead source carried through to payment.
Dashboards & Live Metrics
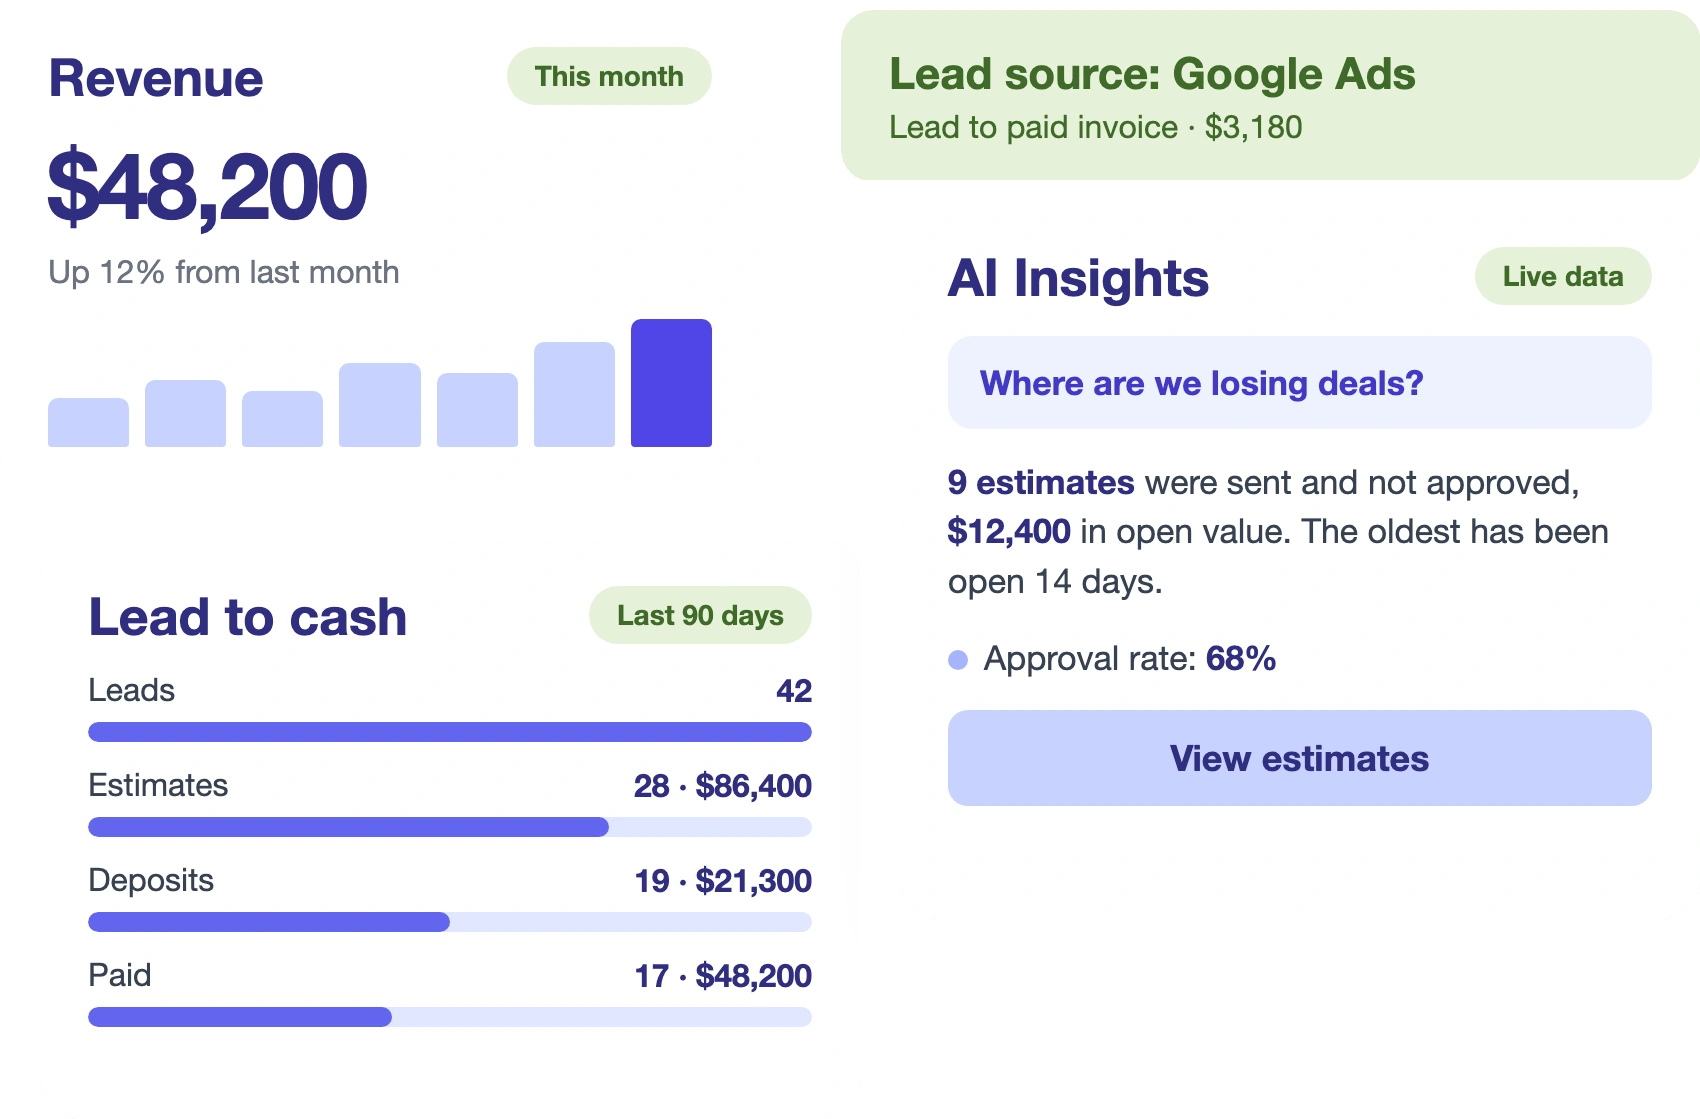
Revenue, receivables, pipeline and lead metrics update from the job record as work moves, on dashboards each team can customize.
Revenue, outstanding receivables, active work orders, completed jobs, open estimates, conversion rate, active leads and accounts on one screen. Switch between 7 days, 30 days, 90 days, year to date and all time, and refresh on demand.
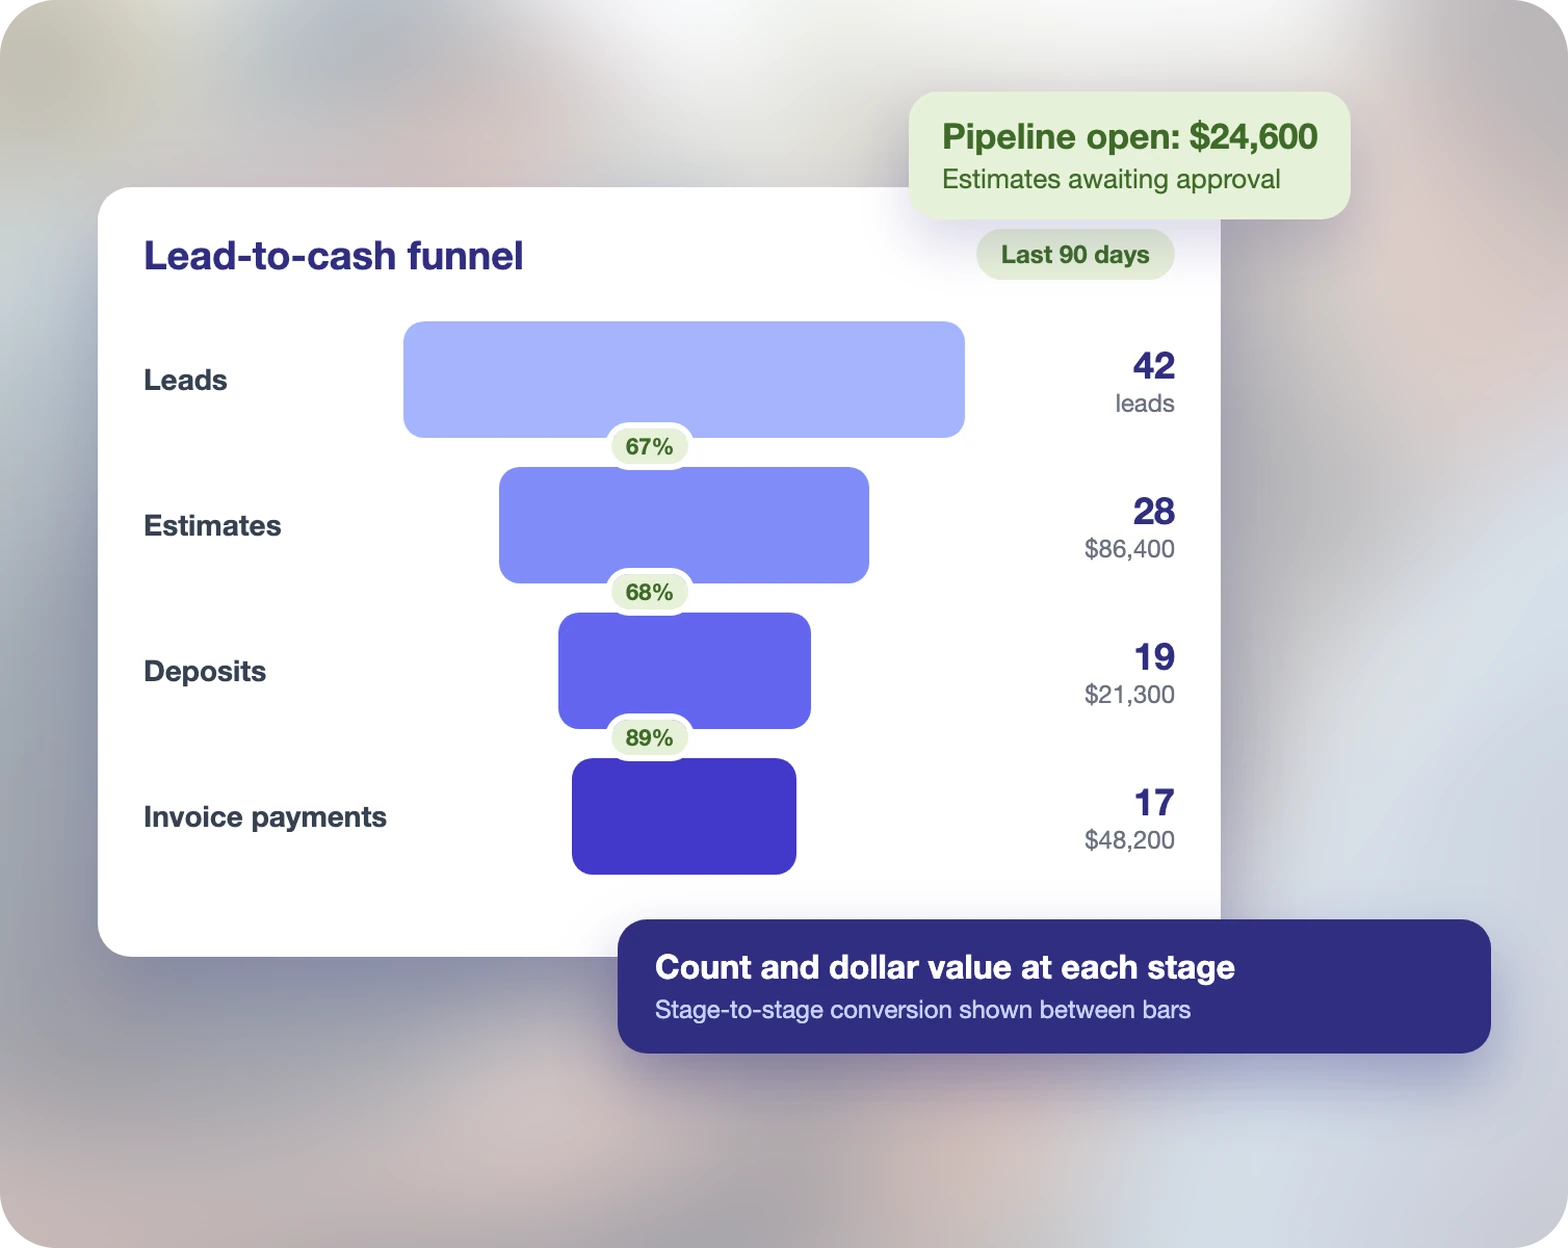
Leads, estimates, deposits and invoice payments in one funnel, with count and dollar value at each stage. Open pipeline value shows beside it.
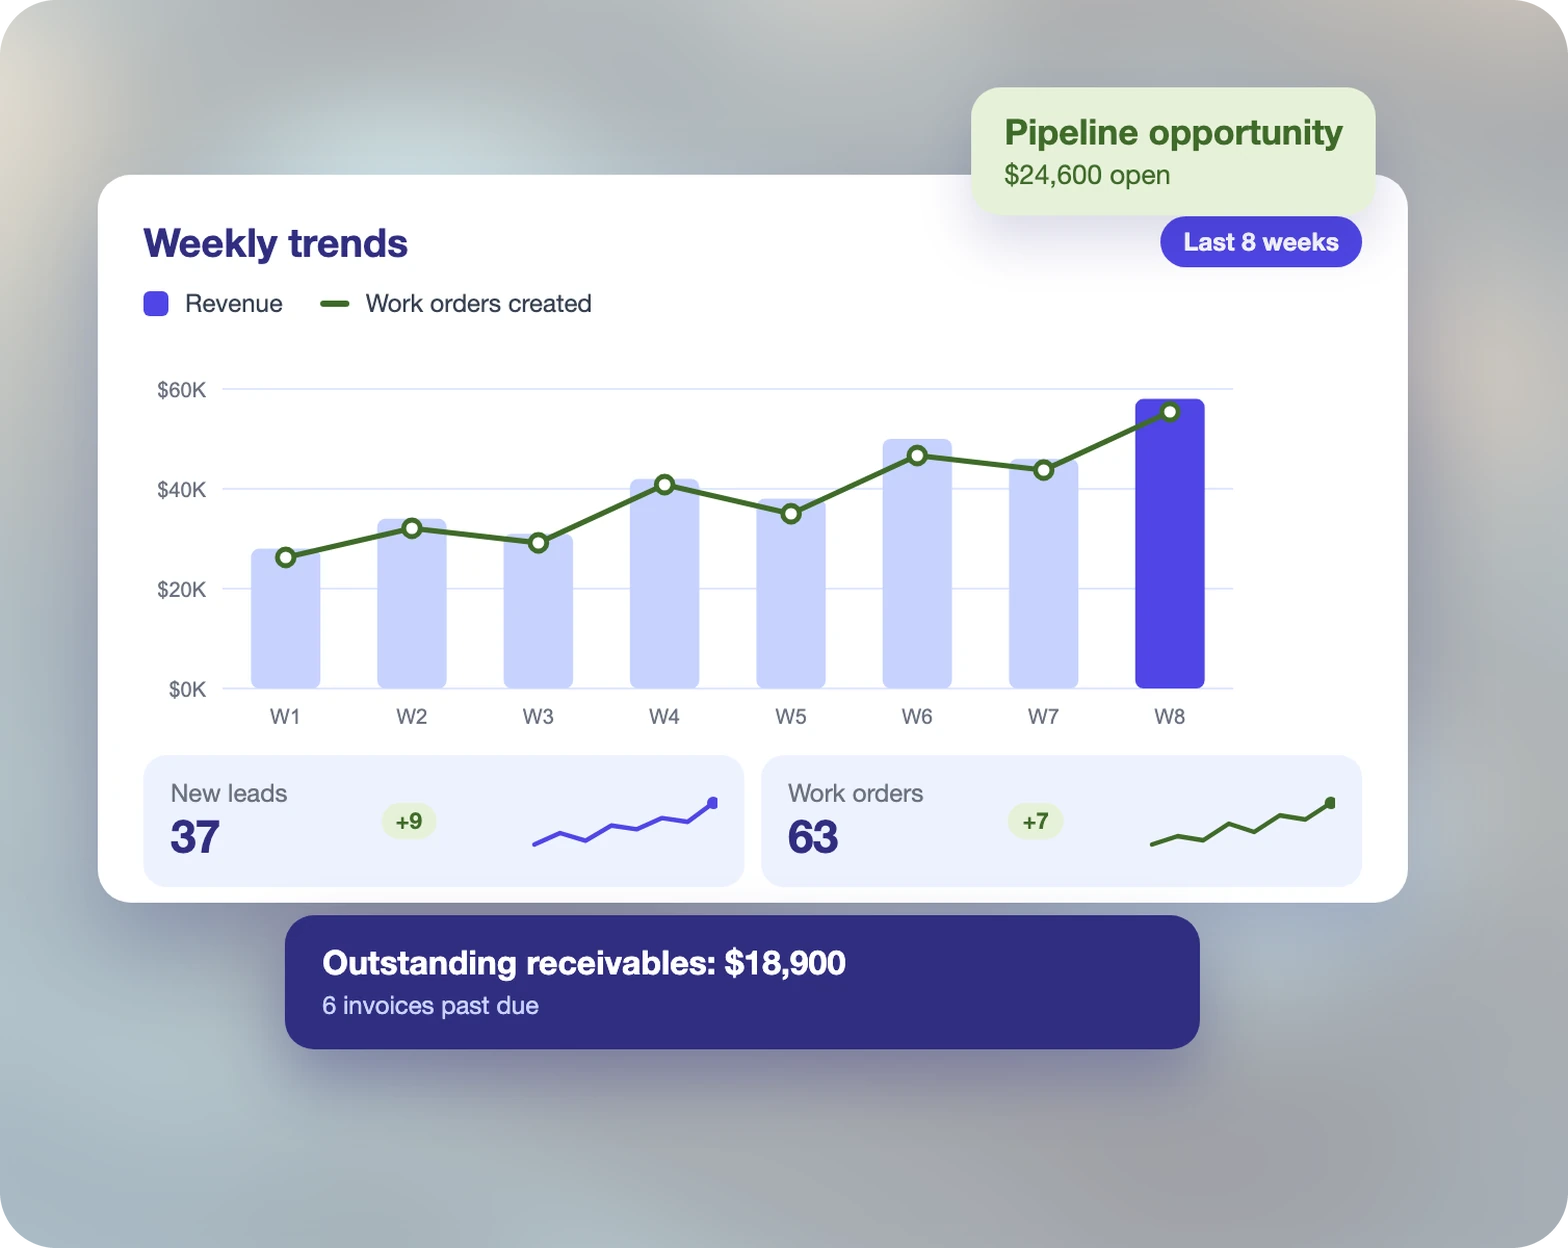
Weekly charts for revenue, work orders created and new leads. Callouts flag outstanding receivables and pipeline opportunity so the figures that need action sit at the top.
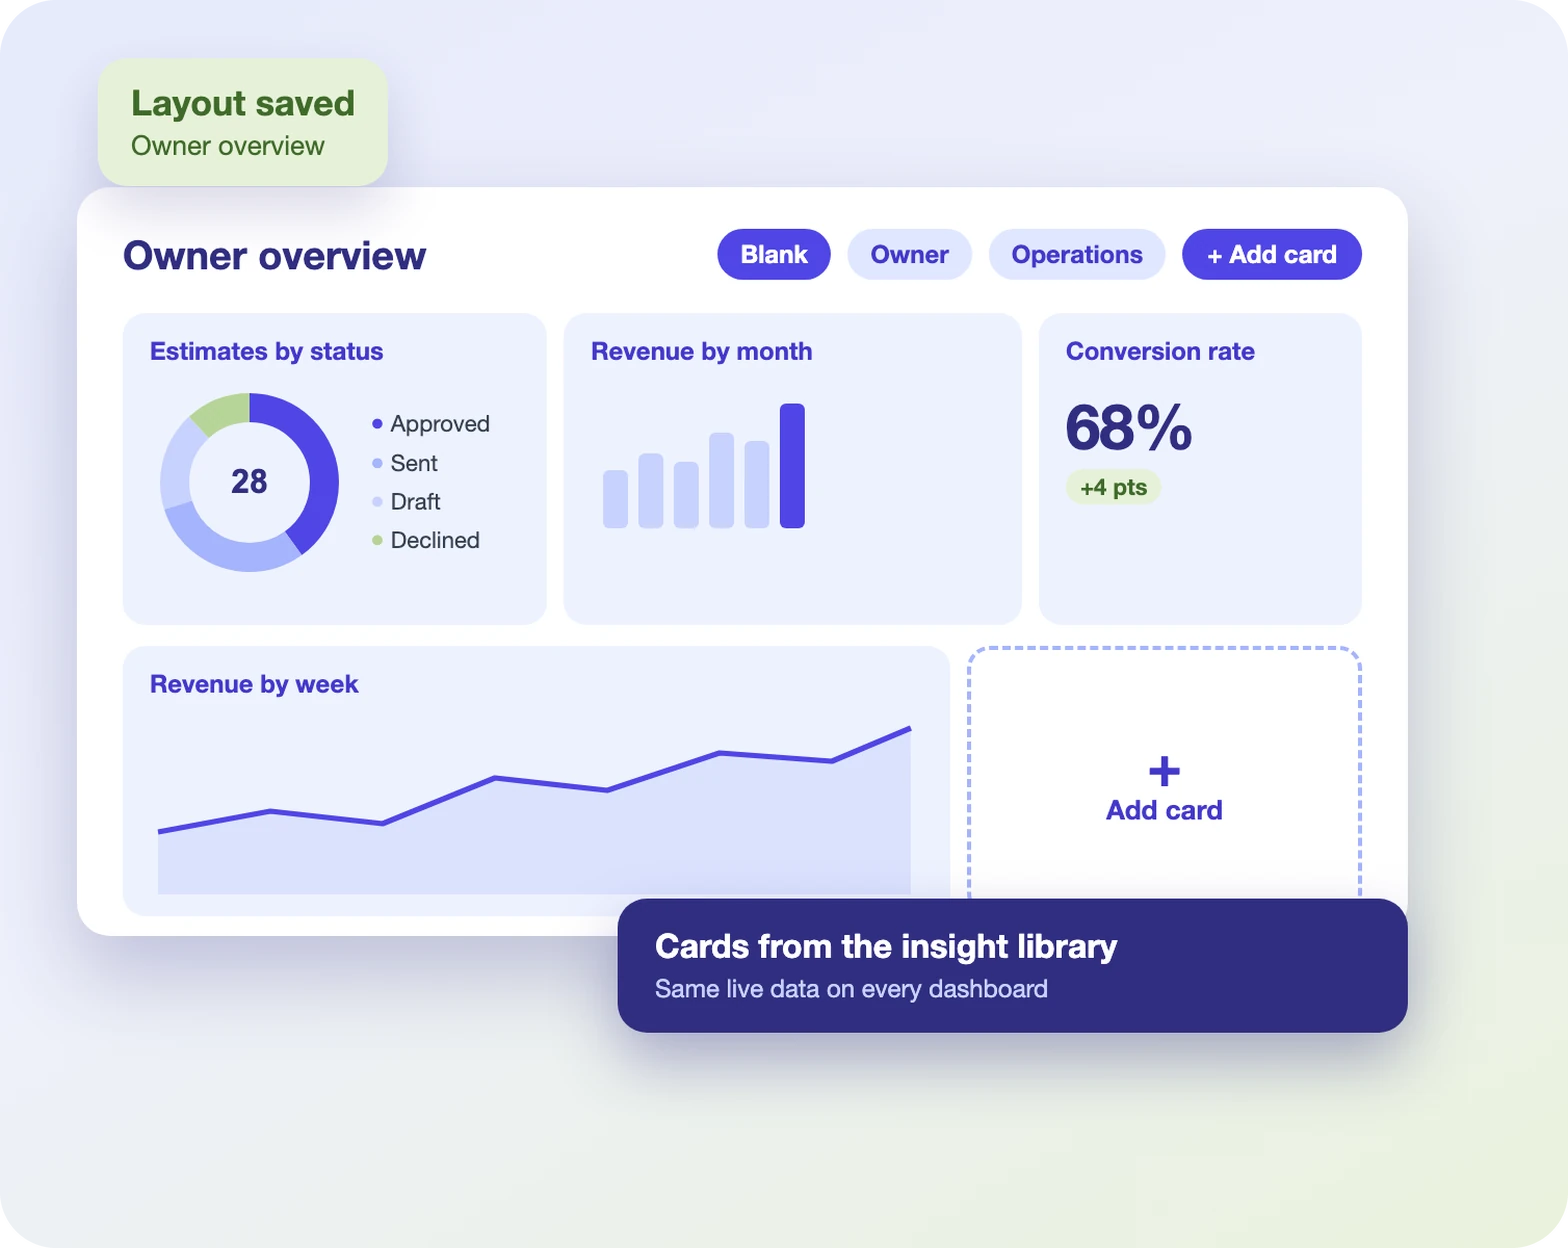
Start from a template or a blank canvas, add cards from the insight library, and save the layout. Each dashboard reads the same live data.
Reports for billing, operations, pipeline and accounts, on screen, exported or delivered on schedule.
Monthly revenue with year-over-year comparison, receivables aged by current, 30, 60 and 90+ days, invoice status totals and expenses by category.
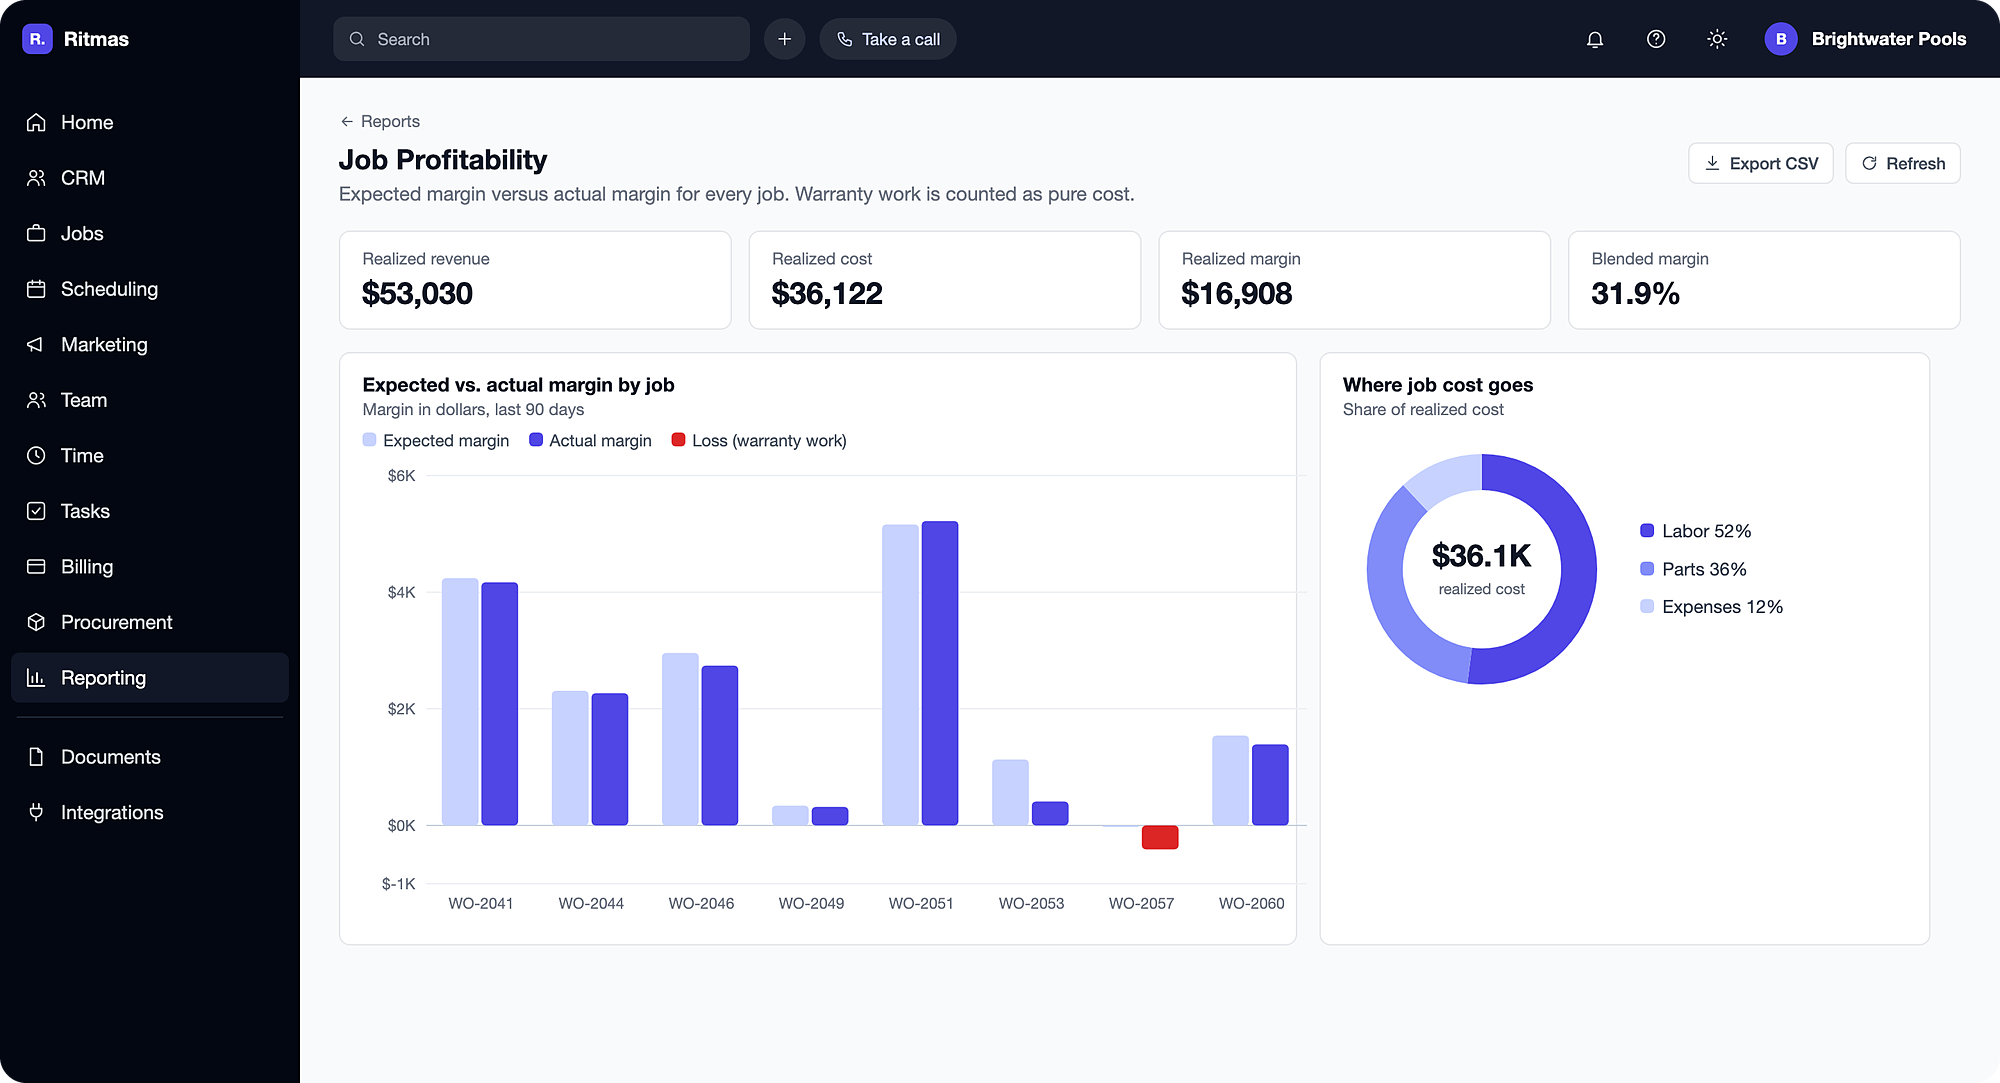
Revenue, cost and margin for every job, with expected margin set against actual.
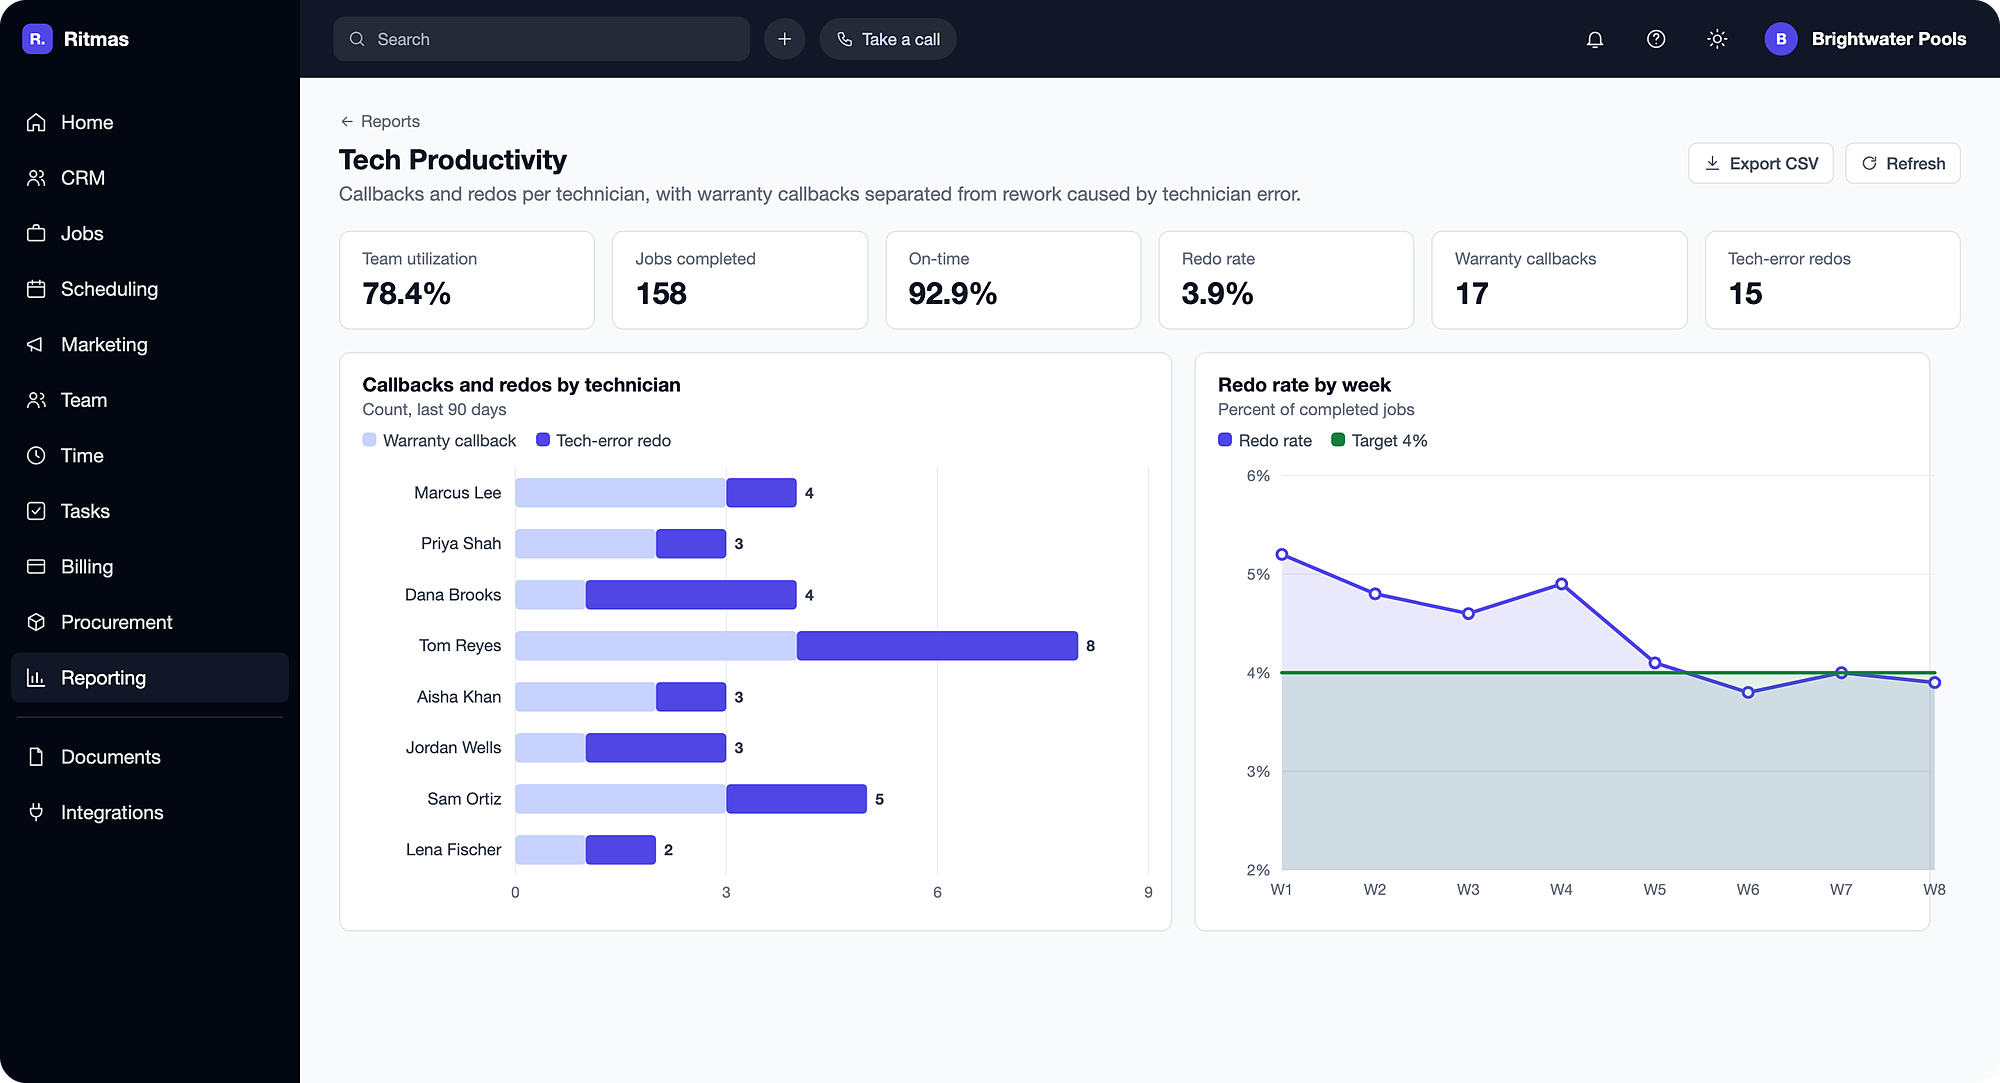
Jobs completed, on-time rate, callback and redo rate, average ticket and close rate for each technician.
Completion rate by week, current work orders by status, and visit volume by day or week with capacity analysis.
Estimates from draft to approved with value at each stage, and conversion rate trends over time.
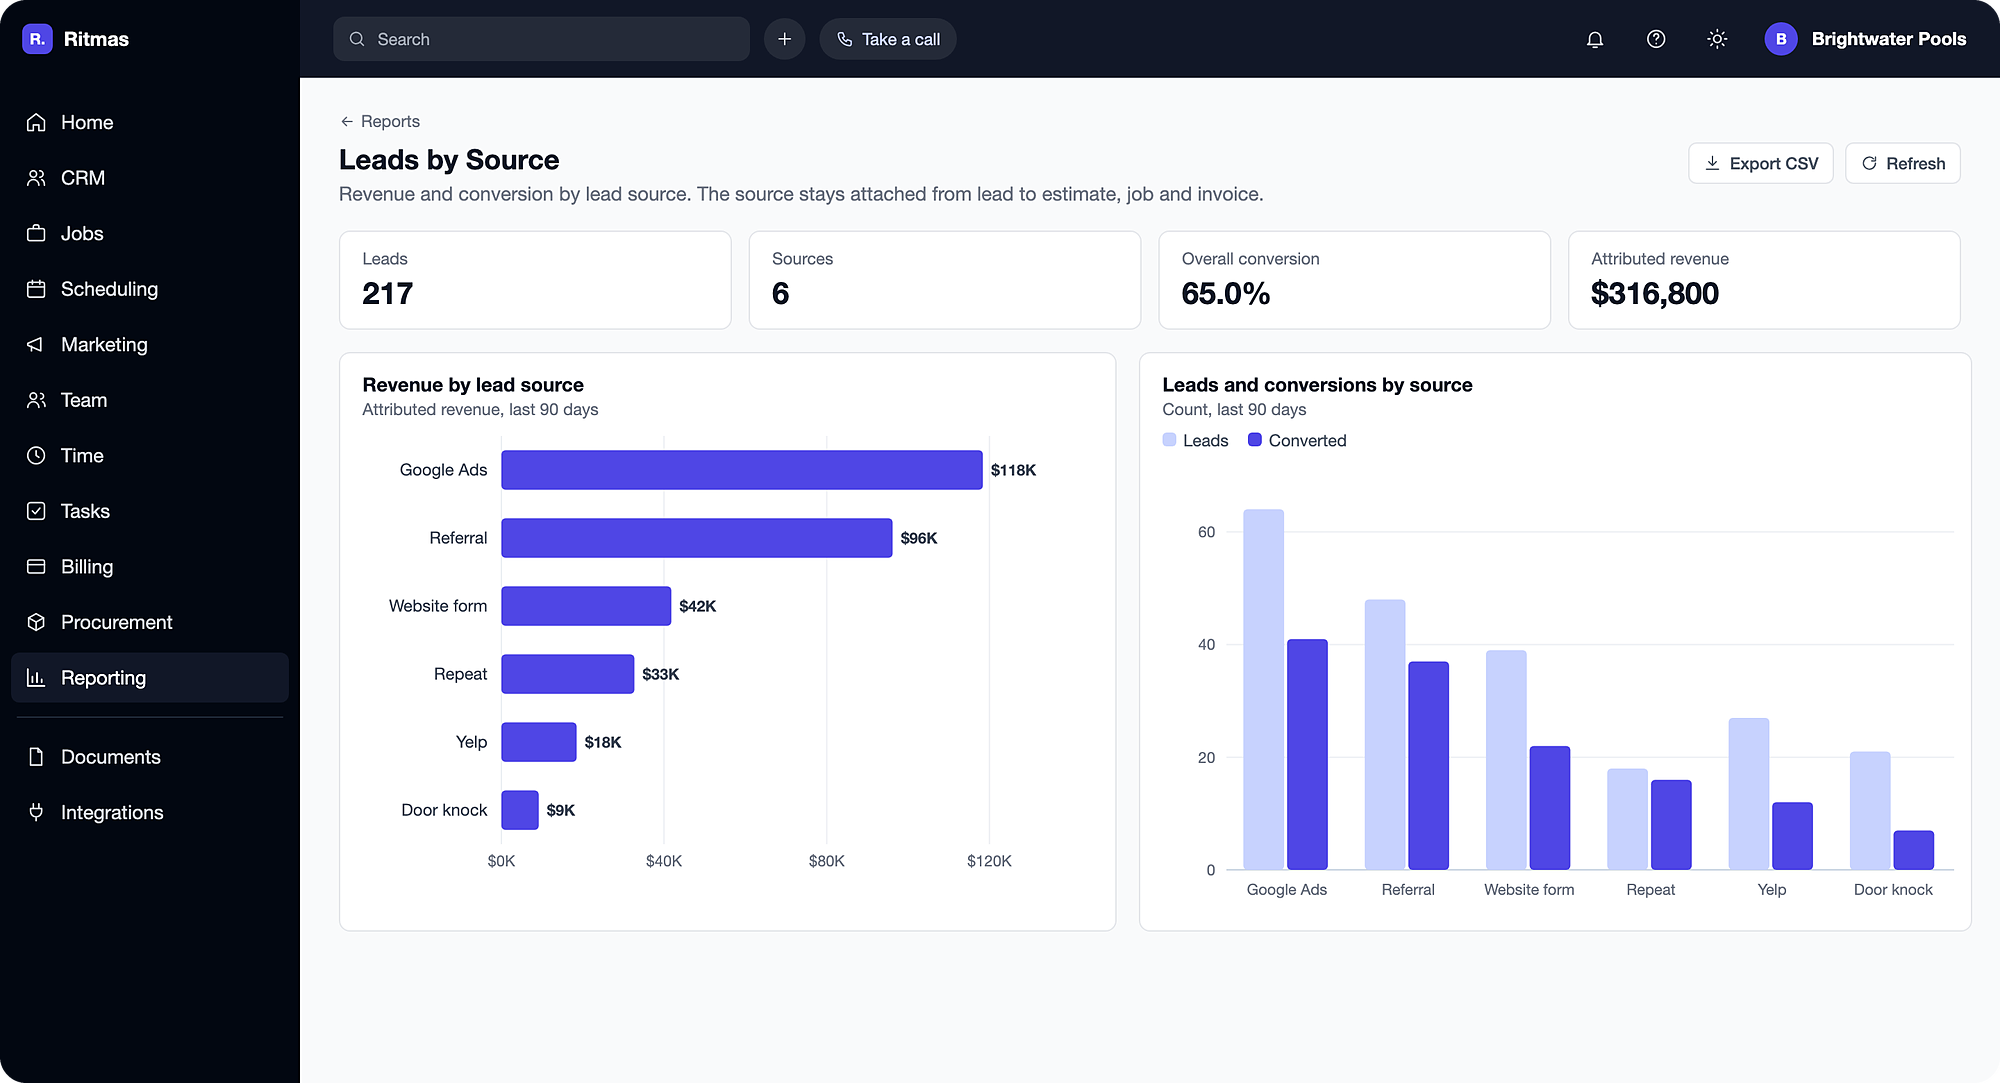
Lead volume and conversion by source, new accounts per month with retention, and top accounts ranked by lifetime value.
Find reports by name or category, download as CSV, email a report, or schedule delivery on a set cadence.
Compare expected margin with actual margin on every job, with warranty work counted as pure cost: labor and materials with no offsetting revenue.
Callbacks and redos are counted for each technician, with warranty callbacks kept apart from redos caused by technician error.
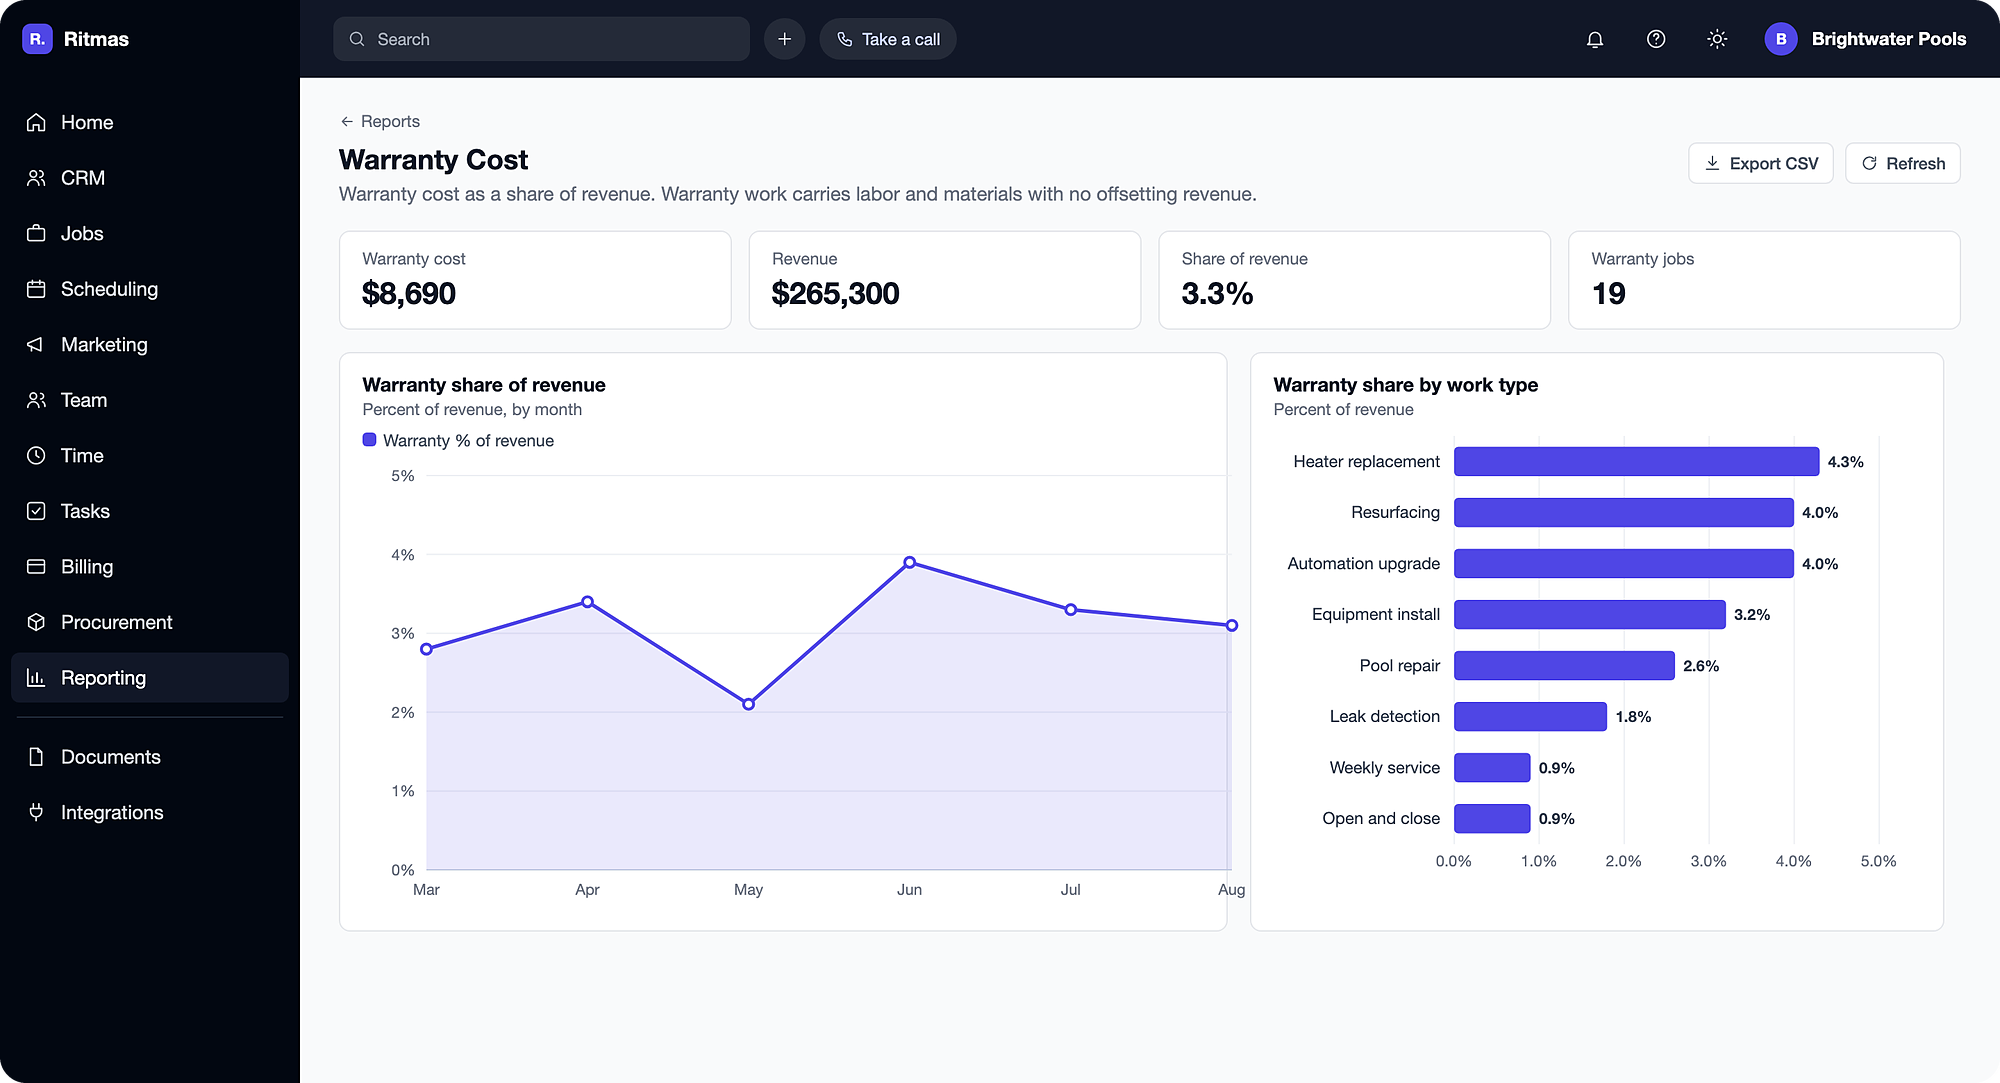
Warranty cost as a percentage of revenue by month and by work type, shown beside job margin.
The lead source stays attached from lead to estimate, job and invoice, with revenue and close rate by source in one report.
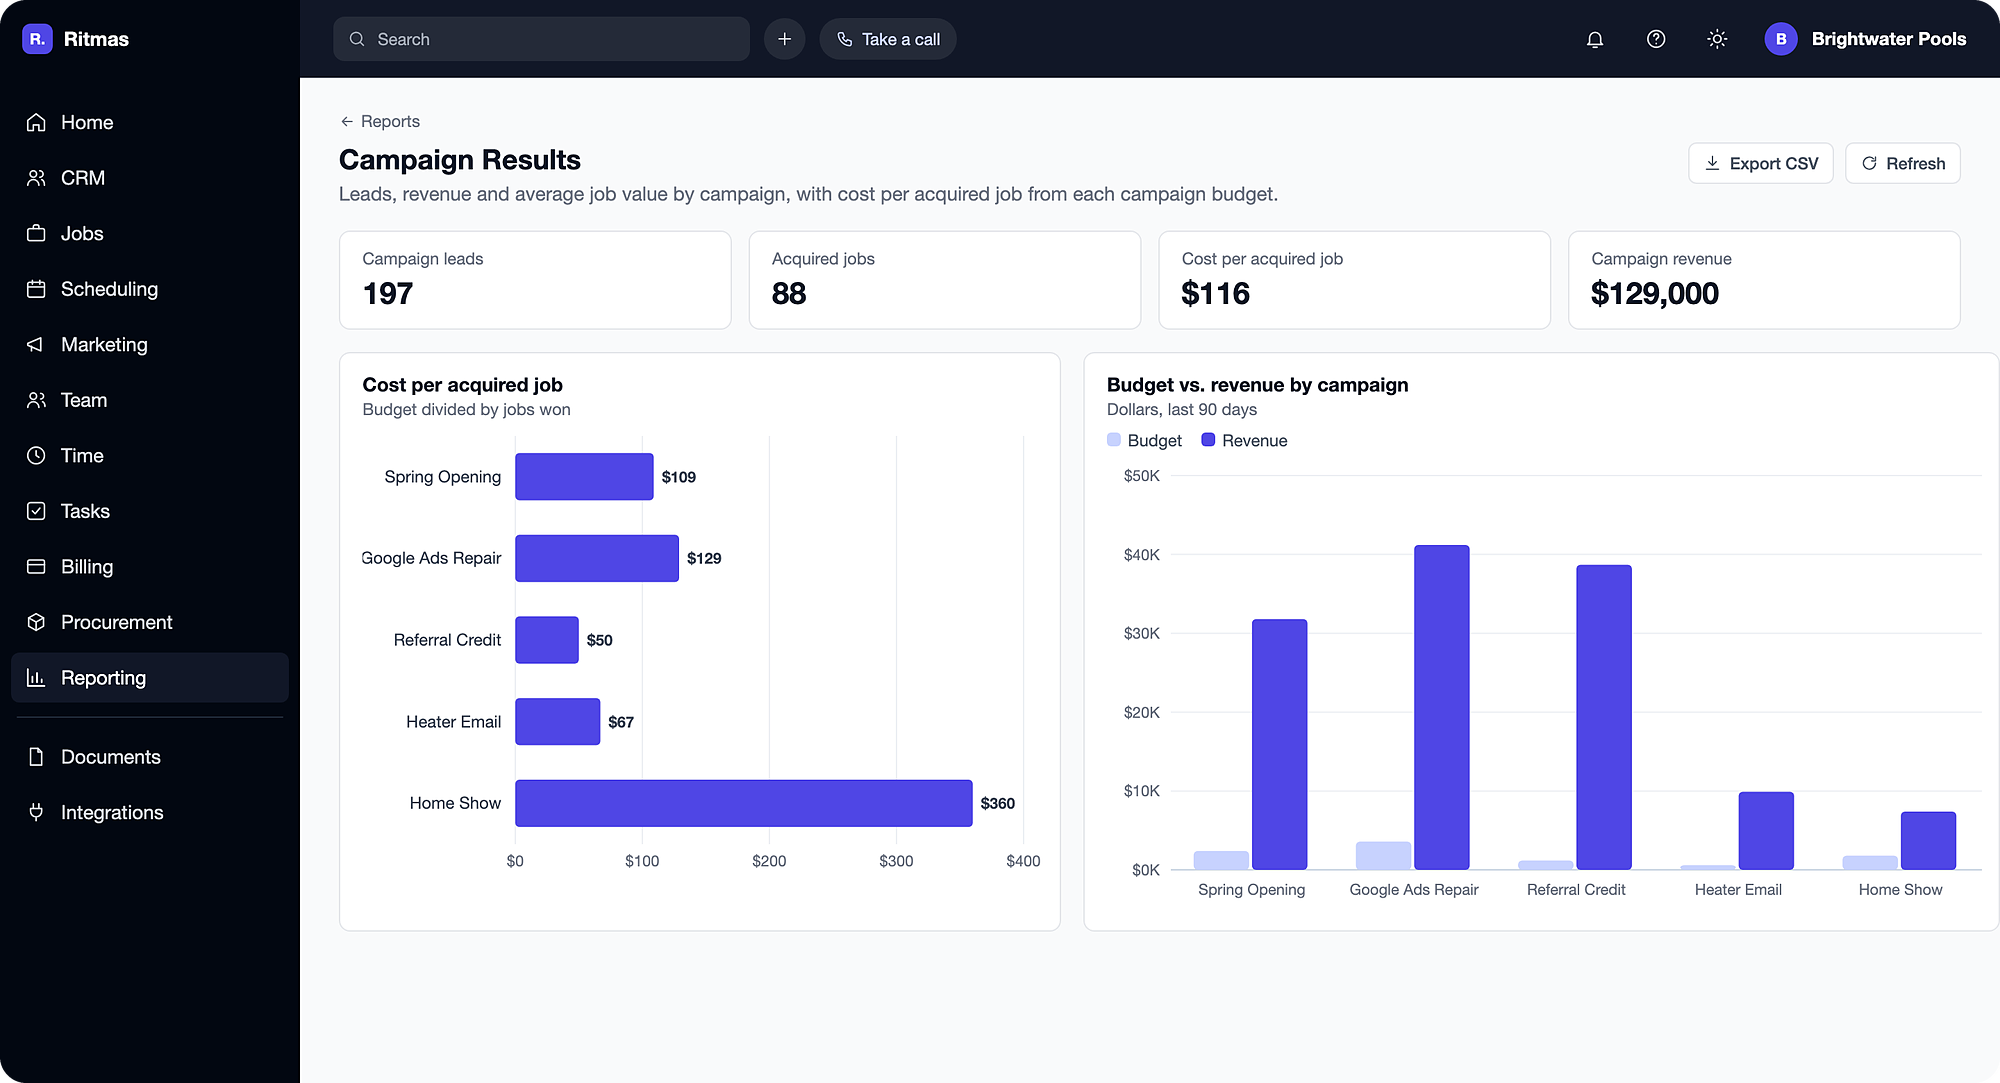
Leads, revenue and average job value by campaign, with cost per acquired job calculated from the budget entered on each campaign.
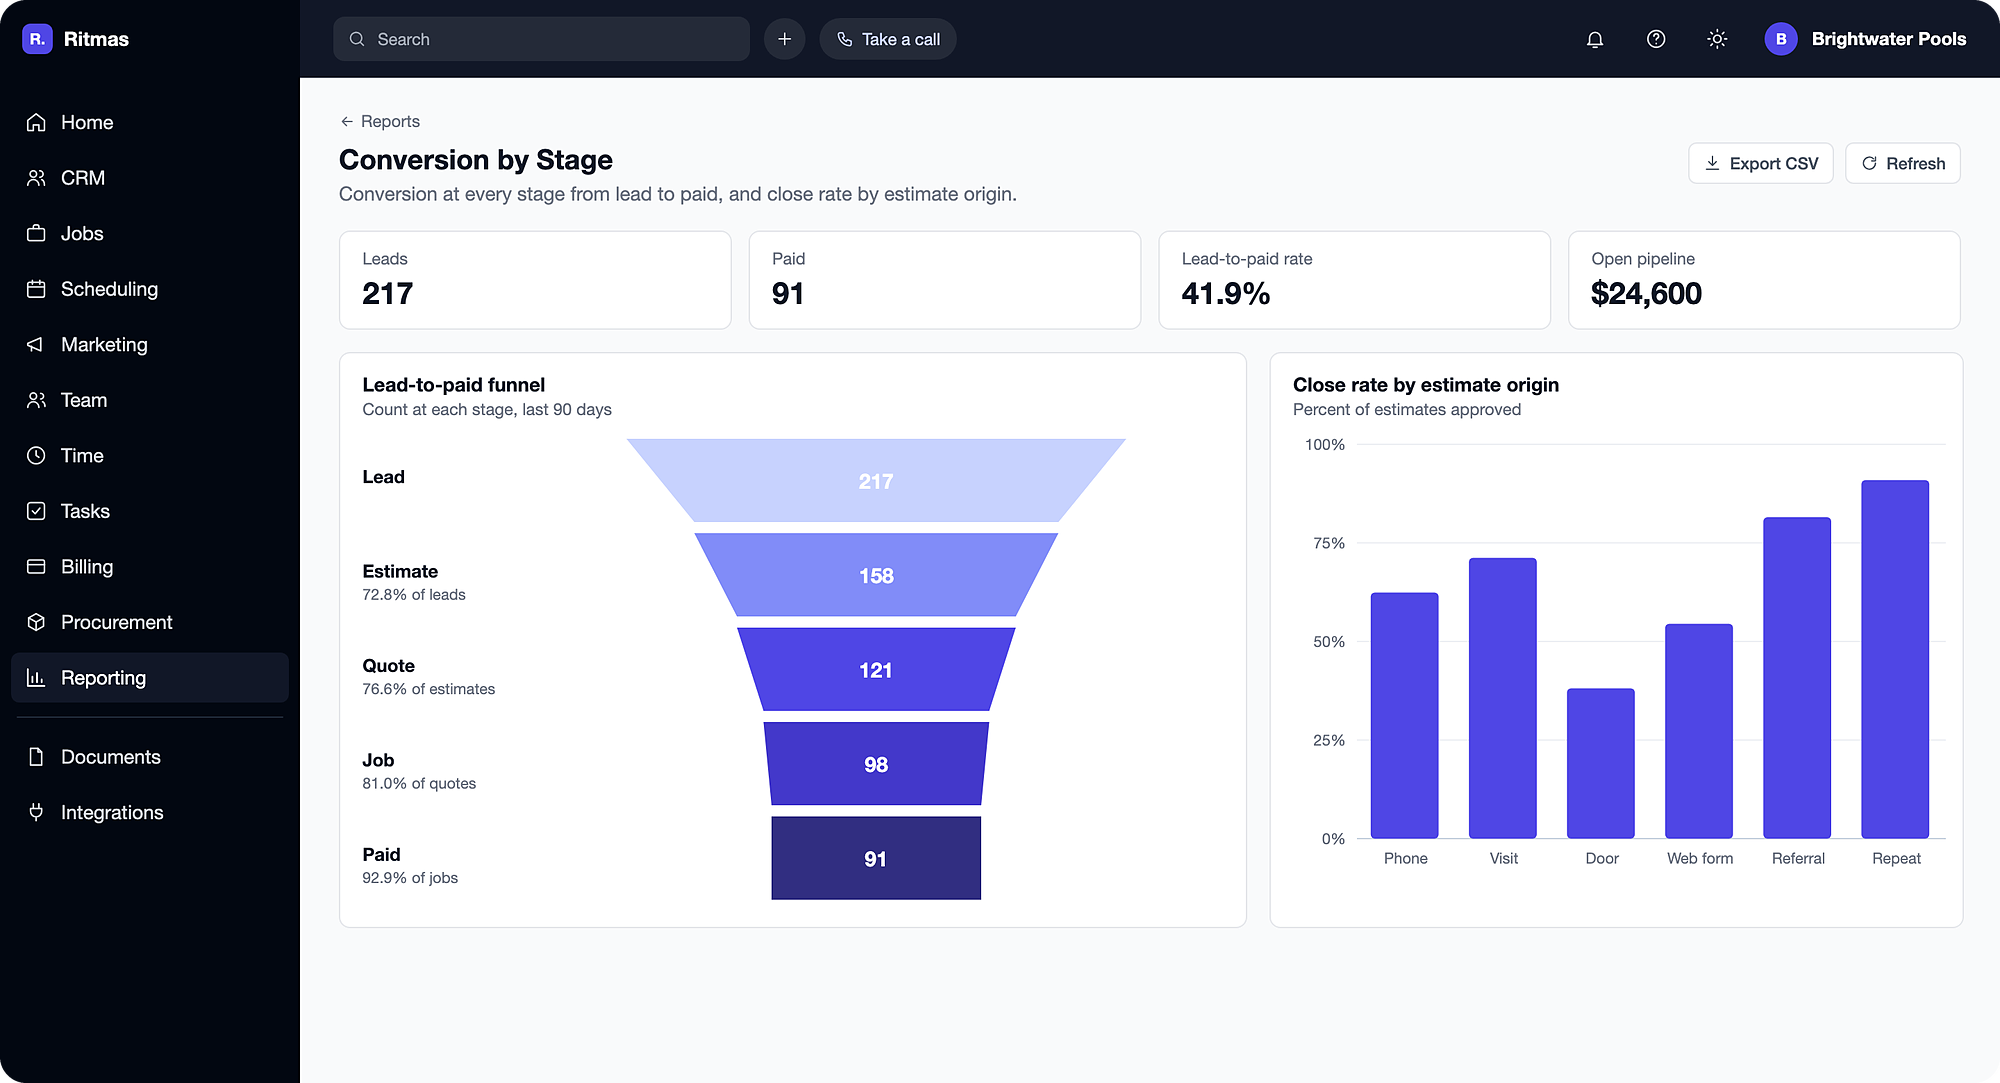
Conversion rate between lead, estimate, quote, job and payment, with close rate by estimate origin: phone, scheduled visit or door knock.
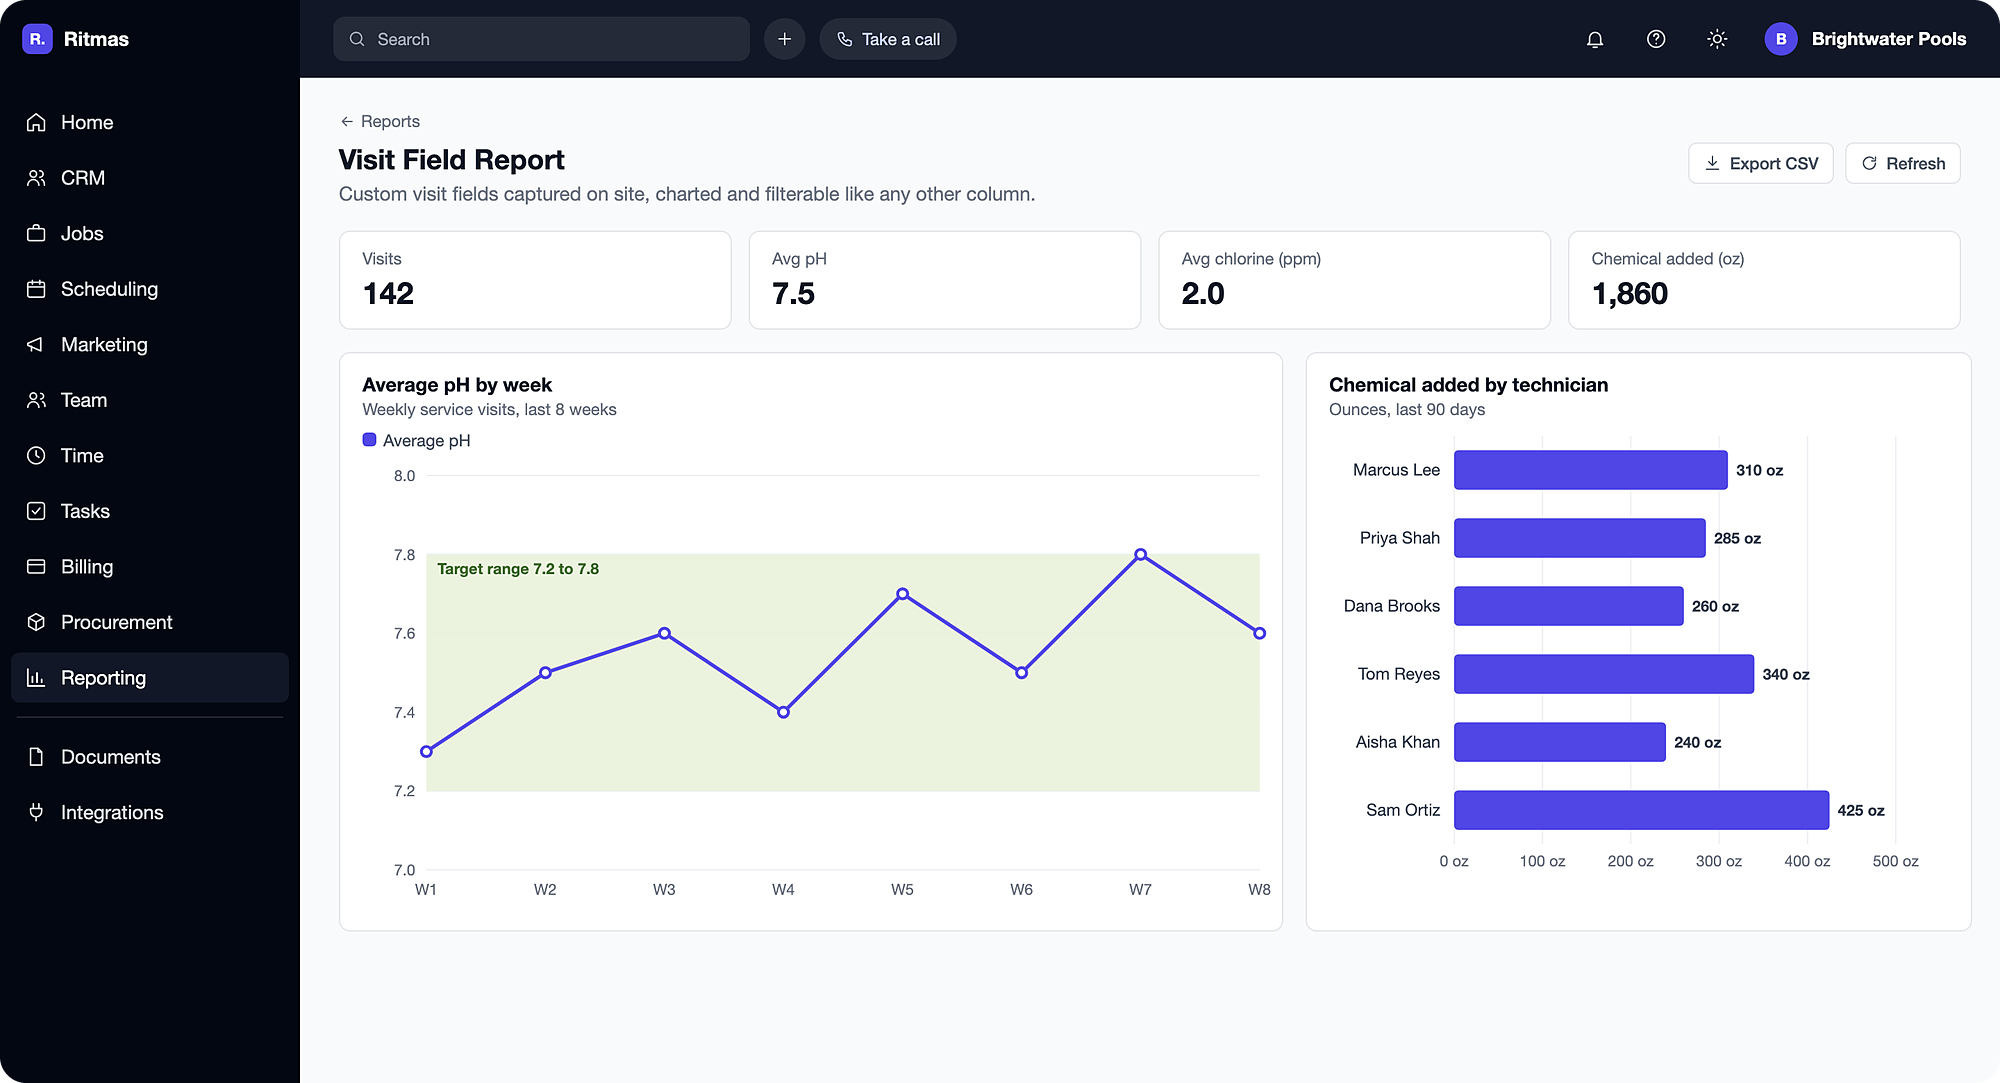
Pool pH and chlorine levels, HVAC refrigerant added and pest control product are saved on the visit. Fields can be required before a visit is closed.
AI Insights
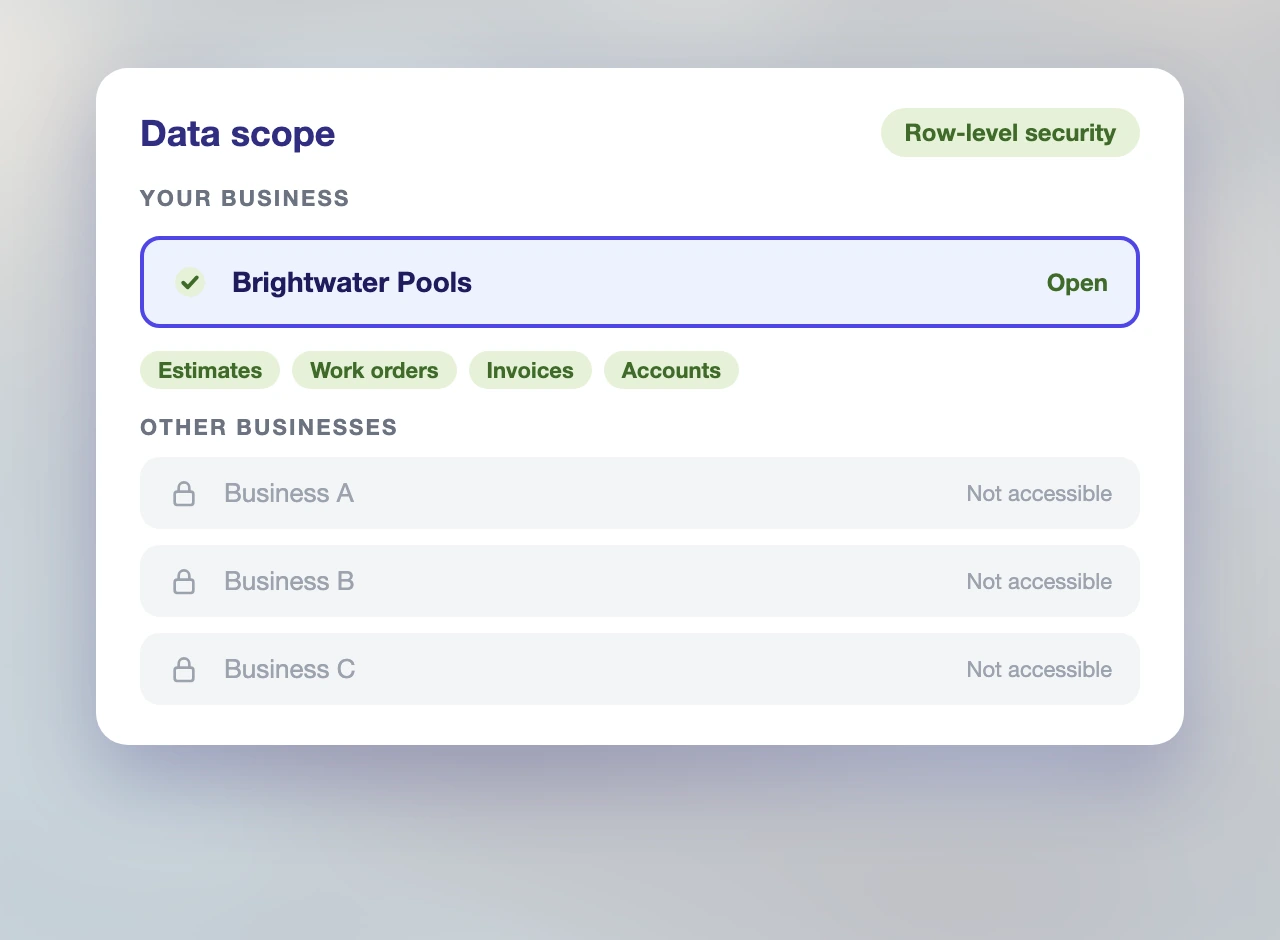
Questions on revenue, receivables, pipeline and margin are answered from current records, with the source cited on every response.
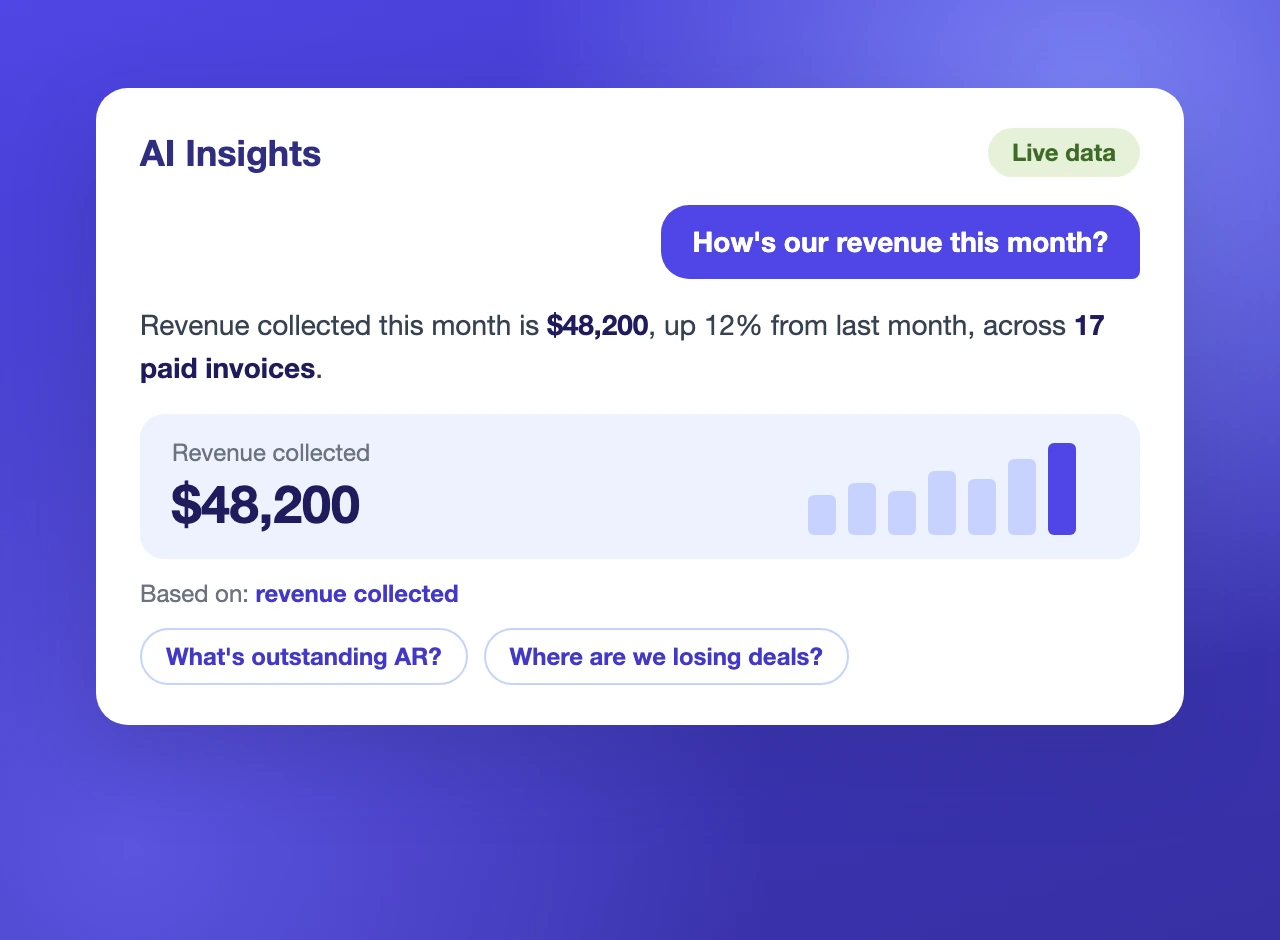
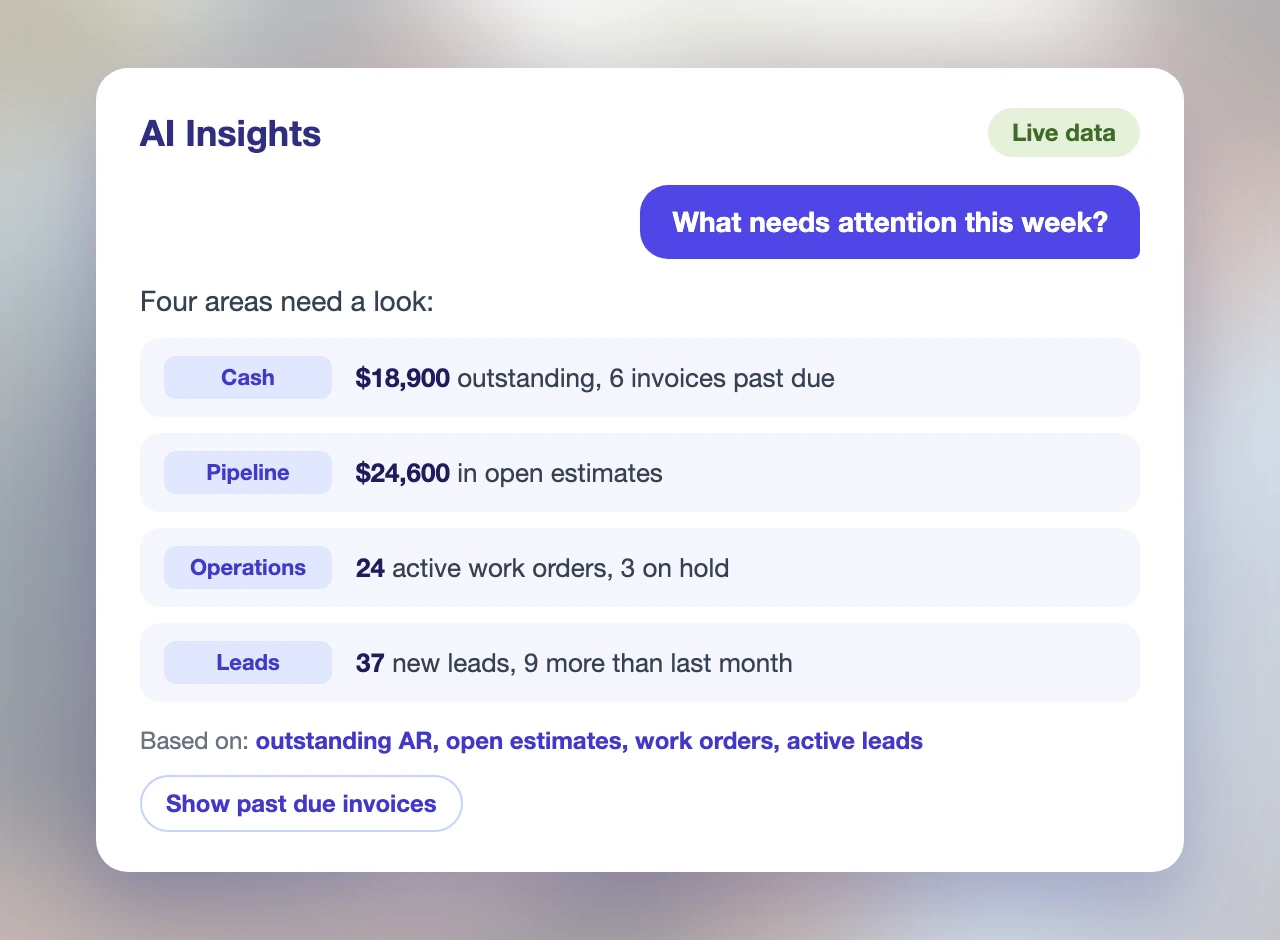
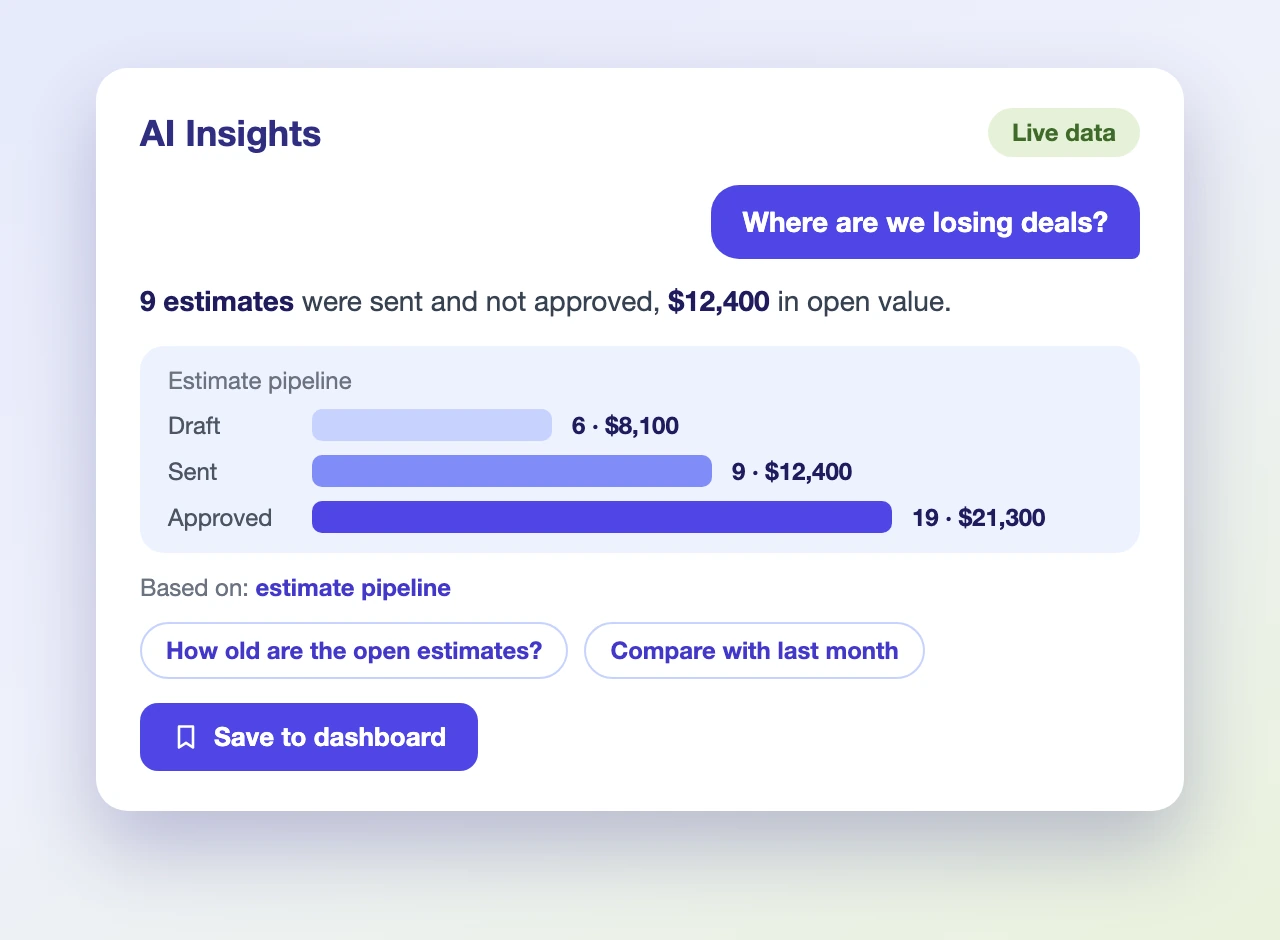
Plain-language queries:Revenue this month
Revenue collected this month, compared with last month, returned as a written answer with a KPI card. Starter prompts cover revenue, receivables, pipeline and daily activity.
Plans and Access
Dashboards, reports and AI Insights are included on every plan. Financial views follow each employee's role.

Dashboards, reports and AI Insights come with every plan, with no upgrade tier, no add-on and no extra fee for any report.
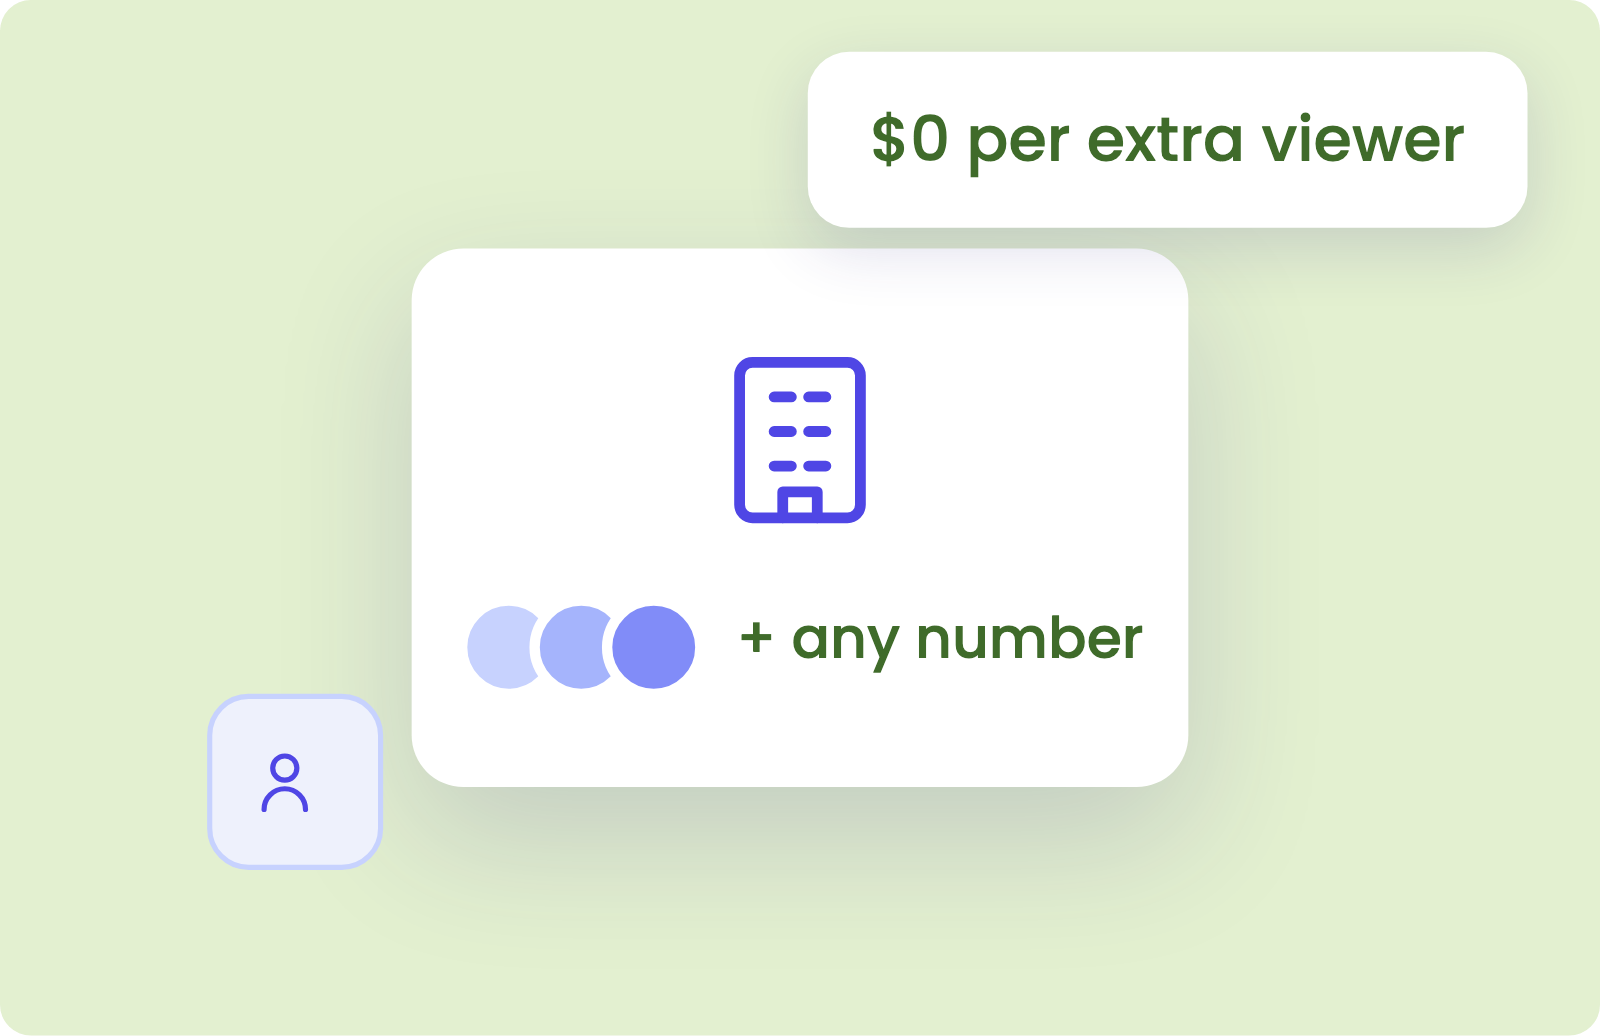
Plans are priced per business, not per seat. Extra people can view dashboards, reports and AI Insights at no added cost.
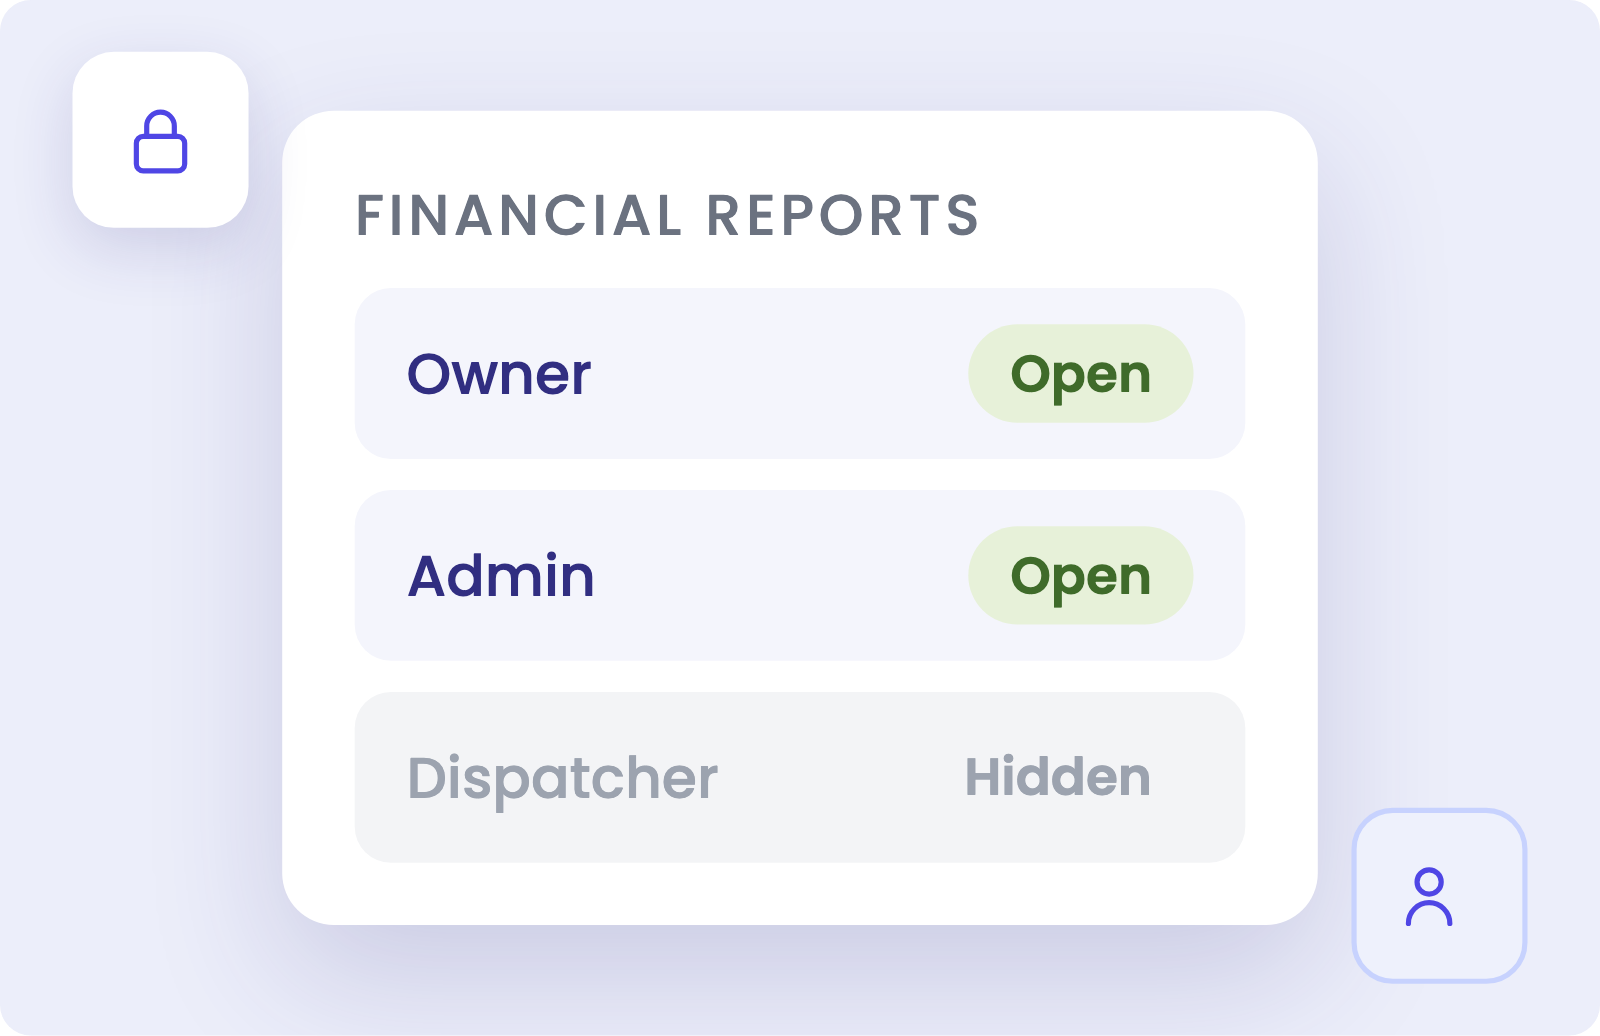
Owners and Admins see financial reports. Dispatchers and technicians do not, and salespeople see only their own estimates.
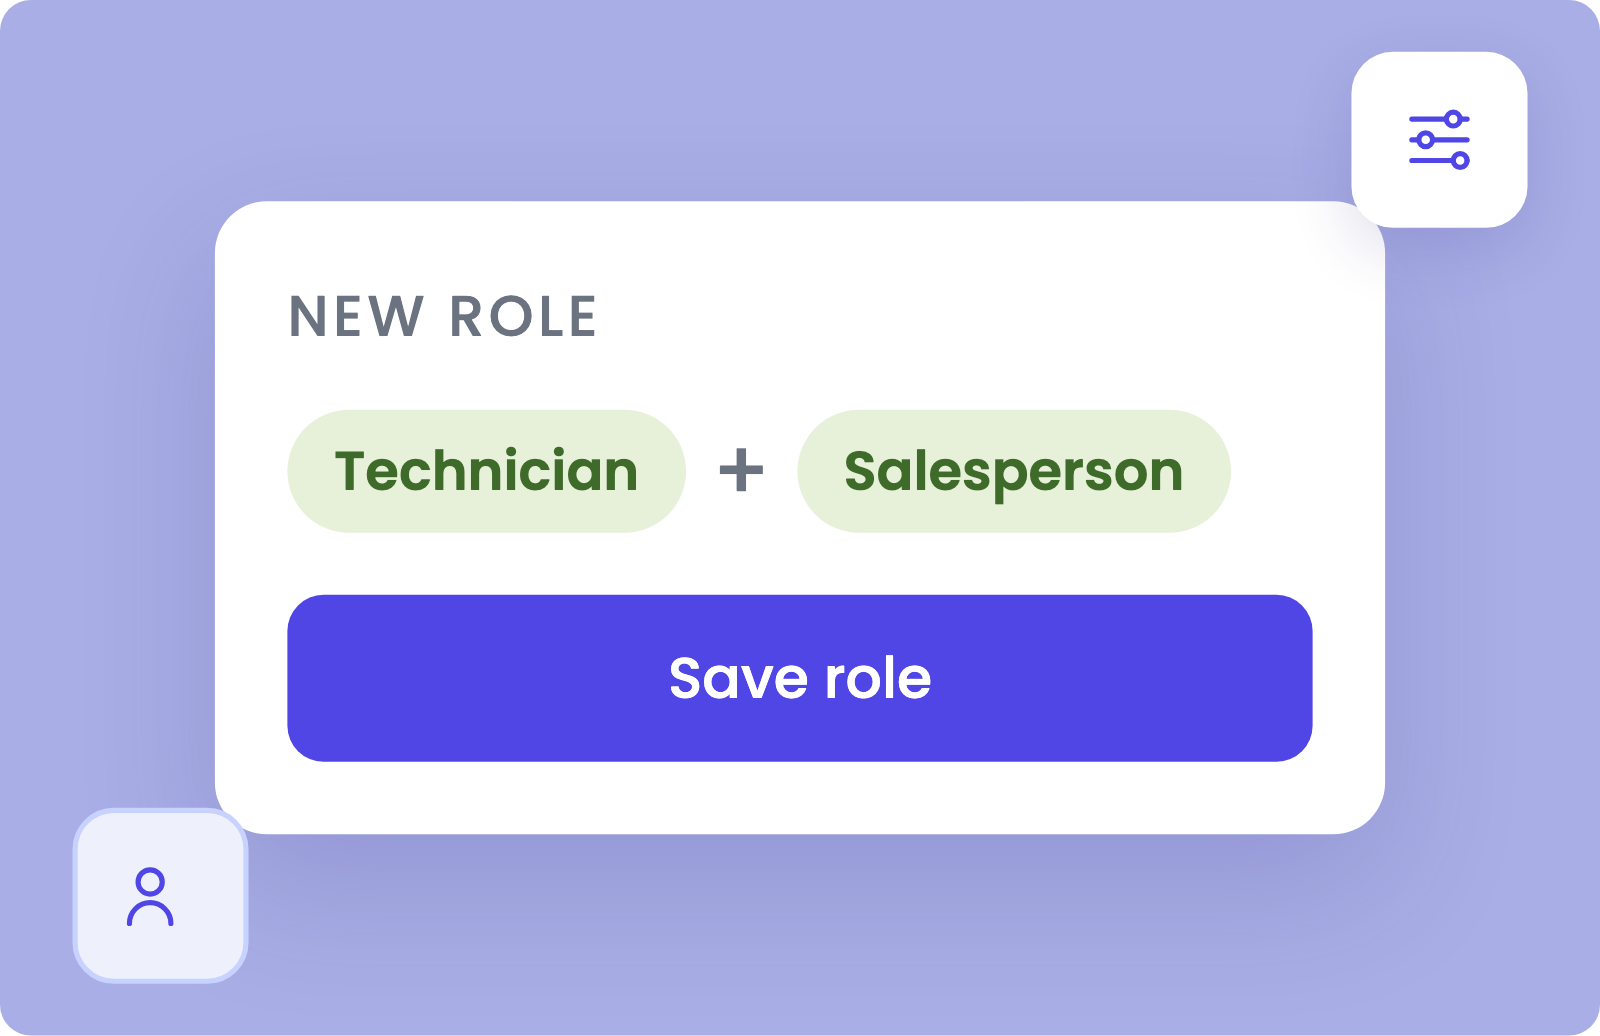
Owners and Admins can create custom roles, and one employee can hold several roles, such as technician and salesperson.
Revenue, job margin, receivables and technician performance, across the whole business.
Yes. Reports run from the same records as schedules, estimates and invoices, so the numbers match the work.
Yes. Lead source is carried through to payment, so you can see which sources lead to paid work.
Yes. The built-in AI consultant answers plain-language questions from your own data, with no report builder required.
Dashboards, reports and AI insights are built into every job workflow, so each role works from the same live figures.
See how Ritmas helps you make faster operating decisions while keeping reports tied to the same live records.